
Most spec sheets throw lumens, candela and lux at you in the same paragraph, as if they were three ways of saying “bright.”
They are not. They answer three different questions. And confusing them is how buyers end up with a lamp that looks impressive on paper and disappointing on the road.
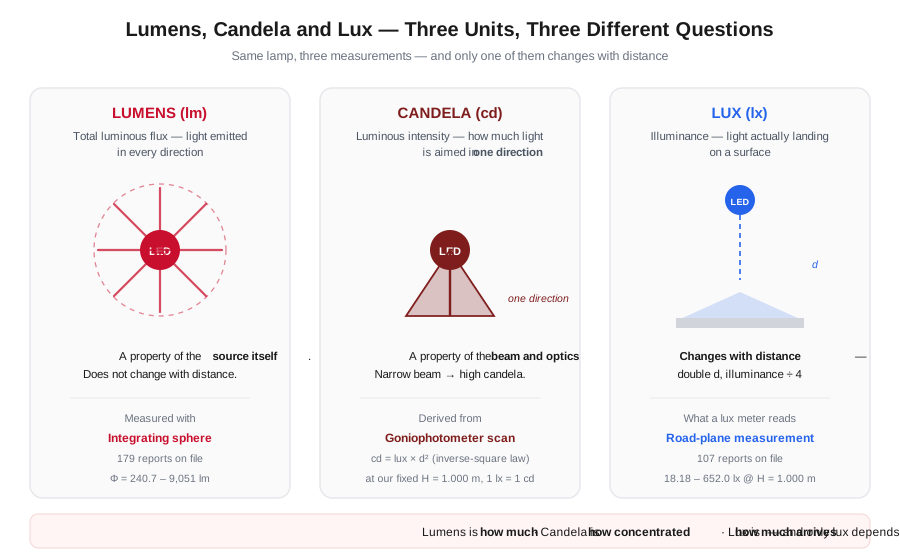
Lumens describe total luminous flux. Candela describes luminous intensity in a direction. Lux describes illuminance on a surface. We use selected DXZ reports to show why these three measurements answer different questions. The paired records share model identifiers — but they were not necessarily produced from the same physical sample, or on the same date.
- Dataset
- 58 selected model-level matches
- Equipment
- Sphere + GO-HD
- Measurement
- H = 1.000 m · 13.2 V
- Source
- DXZ in-house archive
- Lumens = total light emitted. Candela = light aimed in one direction. Lux = light landing on a surface at a given distance and orientation.
- Lumens and candela describe the lamp; lux describes the lamp plus where you are standing.
- Across the 58 selected model-level matches shown below, a total-lumen figure alone does not uniquely determine the recorded GO-HD peak illuminance.
- The sharpest example in these archives: one lamp records 35 % more total lumens yet a measured peak illuminance about one-eighth as high as a smaller-output sibling.
- There is no exact lumens → candela conversion without knowing the beam geometry and its distribution.
On this page
- Lumens vs Candela vs Lux: The Short Answer
- Lumens (lm): How Much Light Leaves the Lamp
- Candela (cd): How Concentrated the Beam Is
- Lux (lx): How Much Light Reaches the Surface
- Converting Between Them (and When the Conversion Breaks)
- What the 58 Model-Level Matches Show
- So Which Number Should You Specify?
- FAQ
Lumens vs Candela vs Lux: The Short Answer
If you remember one thing: lumen ratings are a property of the fixture; lux readings are a property of the situation. The fixture doesn’t change with position. The illuminance reading does — it depends on distance, direction and the orientation of the receiving surface.
Lumens (lm): How Much Light Leaves the Lamp
A lumen is the total luminous flux a source emits, summed over every direction. This is the number on the box, the one quoted in every product listing — and the one most buyers compare.
It is measured in an integrating sphere: a large hollow sphere with a highly reflective white interior. The lamp is mounted inside, the sphere mixes the emitted light into a uniform field, and a spectrometer reads the total flux.
Every direction contributes equally, so the sphere is the right instrument for a “total output” number. It is the wrong instrument for anything to do with beam shape.
Across our white-light production — 165 white-light sphere reports, each carrying a recorded flux value — total output runs from 240.7 lm to 9,051 lm, with a median of 1,659 lm. That span covers everything from compact marker units to full-width light bars.
It is a useful number. On its own, though, it tells you almost nothing about what the lamp will light up. Here is why.
Consider two lamps from the same 4C product family:
| Model | Total output Φ | Measured peak illuminance @ H = 1.000 m | Peak illuminance per 1,000 lm |
|---|---|---|---|
| 4C-BW-37Y | 1,131 lm | 231.5 lx | 204.7 |
| 4C-F64F | 1,529 lm | 27.74 lx | 18.1 |
The second lamp produces about 35 % more total light — yet its measured peak illuminance is only about one-eighth as high. Both numbers are correct. Both come from our own reports.
Beam distribution is one possible explanation, but these two pairs alone don’t isolate the cause. Both records were produced near 13.2 V, with the lamp on the same mounting geometry. But the sphere run and the GO-HD run are separated in date. The two GO-HD scans also used slightly different survey areas (200 × 40 mm and 200 × 38 mm). So the pair is not a controlled experiment. What it does show: the difference isn’t total output — it is where the output goes.
Candela (cd): How Concentrated the Beam Is
Candela is luminous intensity — the light emitted in one particular direction, expressed as lumens per steradian (lm/sr). If lumens are the total water in the tank, candela is the pressure at the nozzle.
This is where beam optics live. Push the same LED output through a narrow reflector and the solid angle shrinks, so candela rises. Push it through a wide flood optic and the light is spread across a bigger cone, so candela falls.
Total lumens can stay identical while candela changes by an order of magnitude.
This is why candela vs lumens is the comparison that actually matters for driving lights, spot lights and long-range auxiliaries. A beam that has to reach down the road is a beam-concentration problem, not a total-output problem.
It is also why the peaks you see in our own data do not line up with the lumen column.
Lux (lx): How Much Light Reaches the Surface
Lux is illuminance — one lumen per square meter. It quantifies the light falling on a target surface. It is widely used when specifying how much light reaches a work area or a road surface.
It is the only one of the three units that changes with position. Take a point-source approximation, with the receiving surface perpendicular to the incident direction. Now the inverse-square law applies: double the distance, and illuminance drops to one quarter. Move the measurement point off-axis, or tilt the receiving surface, and the intensity in that direction sets the reading — not the distance alone.
Across our 100 unique GO-HD illuminance reports, measured on the road plane at a fixed mount height of H = 1.000 m:
- Peak illuminance ranges from 18.18 lx to 652.0 lx, with a median of 108.75 lx.
- Every report is a road-facing beam measurement — a partial measurement window (vertical −10°…+5°, horizontal −30°…+30°), not a full-sphere distribution. That is the right method for a forward-facing lamp, and we don’t present it as anything else.
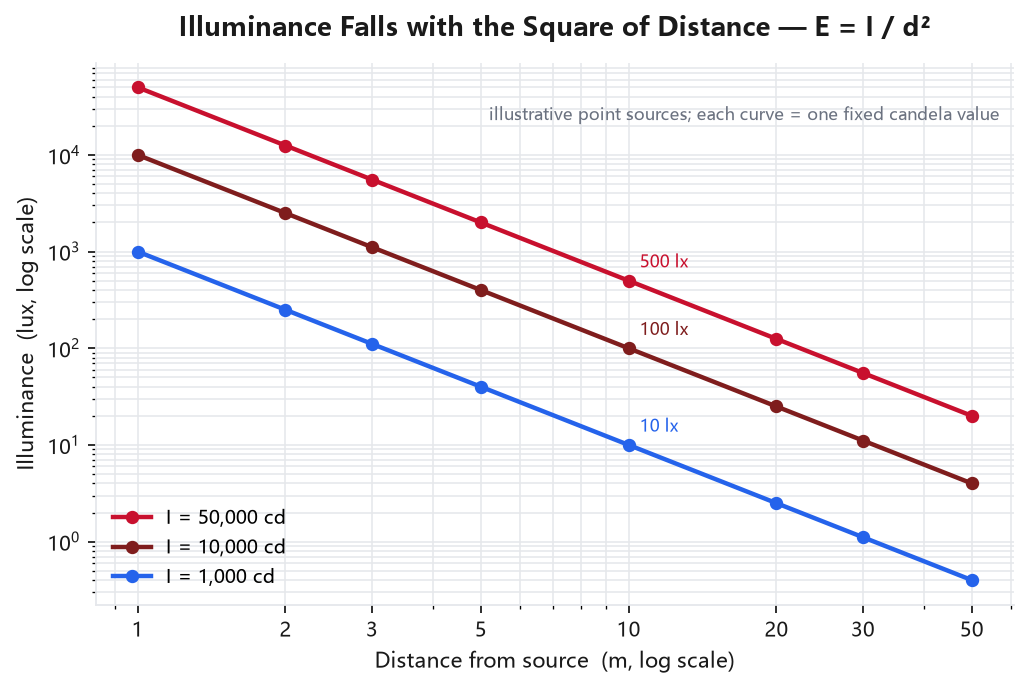
One honest note about this figure: we deliberately plot illustrative fixed-intensity sources rather than our own lamps. Our GO-HD reports measure illuminance on a road plane. Turning that into a candela curve would require assumptions the measurement itself does not justify. So we keep the physics clean and the product data in Figure 3, where it belongs.
Converting Between Them (and When the Conversion Breaks)
Two relationships link the three units. One is trustworthy under stated conditions. The other needs a caveat you shouldn’t skip.
Candela ↔ Lux: exact in principle, approximate in practice
E (lx) = I (cd, in the direction of the measurement) × cos θ / d² — when the surface is perpendicular, cos θ = 1: E = I / d²
Say a lux meter reads 50 lx at 5 m from a directional source. That source’s intensity is 50 × 5² = 1,250 cd in that direction, with the receiving surface perpendicular to the incident ray and d the actual light-path distance. The simplified form E = I / d² holds only at that orientation. Where the surface is tilted, the cosine term of the general form applies instead.
Caveat, stated plainly: the inverse-square law assumes a point source and a receiving surface perpendicular to the incident direction. A real lamp has a physical aperture, and a vehicle lamp is an extended source. So near-field geometry and scene reflections can break the simple form at short range. Treat this as an engineering relationship for well-separated source and receiver — not a certified calibration. And remember that d is the light-path distance, which is not the same as the mounting height H at every point on a road plane.
Lumens ↔ Candela: there is no exact conversion
I_avg (cd) = Φ (lm) ÷ [2π × (1 − cos(θ/2))]
That formula holds for an idealized uniform circular cone. It estimates the average luminous intensity inside that cone — not the lamp’s true peak candela.
Real automotive and work-light beams are not uniform — brightness varies across the beam. So there is no exact conversion from total lumens to peak candela for a real lamp. The uniform-cone shortcut is sound for estimating an average intensity inside the cone. It should not be applied unconditionally to the peak intensity of a real lamp. For a real lamp, measure peak candela from the angular intensity distribution.
If you searched for “how many lumens in a candela” hoping for a single number, here is the honest answer. The factor doesn’t exist without the beam geometry — and it doesn’t exist without an assumption about how light is distributed inside the beam. For anything contractual, measure the distribution.
- Instrument A
- Integrating sphere — total luminous flux Φ (lm), efficacy, CCT and Ra.
- Instrument B
- EVERFINE GO-HD — road-plane peak illuminance at H = 1.000 m.
- Matching rule
- Exact model identifier present in both archives; white-light models only.
- Excluded
- 5 models whose re-scans disagree, 1 × 24 V unit, 1 colour-changing model.
- Caveat
- A model-level comparison across archived tests — the two reports were produced on different dates, not on the same physical unit at the same moment.
What the 58 Model-Level Matches Show
Theory is cheap. Here is the data.
We matched our archives and found 58 white-light model identifiers that carry both an integrating-sphere report (total luminous flux) and a GO-HD illuminance report (peak illuminance).
These are model-level comparisons across archived tests — not measurements of the same physical specimen taken simultaneously. The two reports for a given model were produced on different dates, and we treat the match as same model identifier, not same unit.
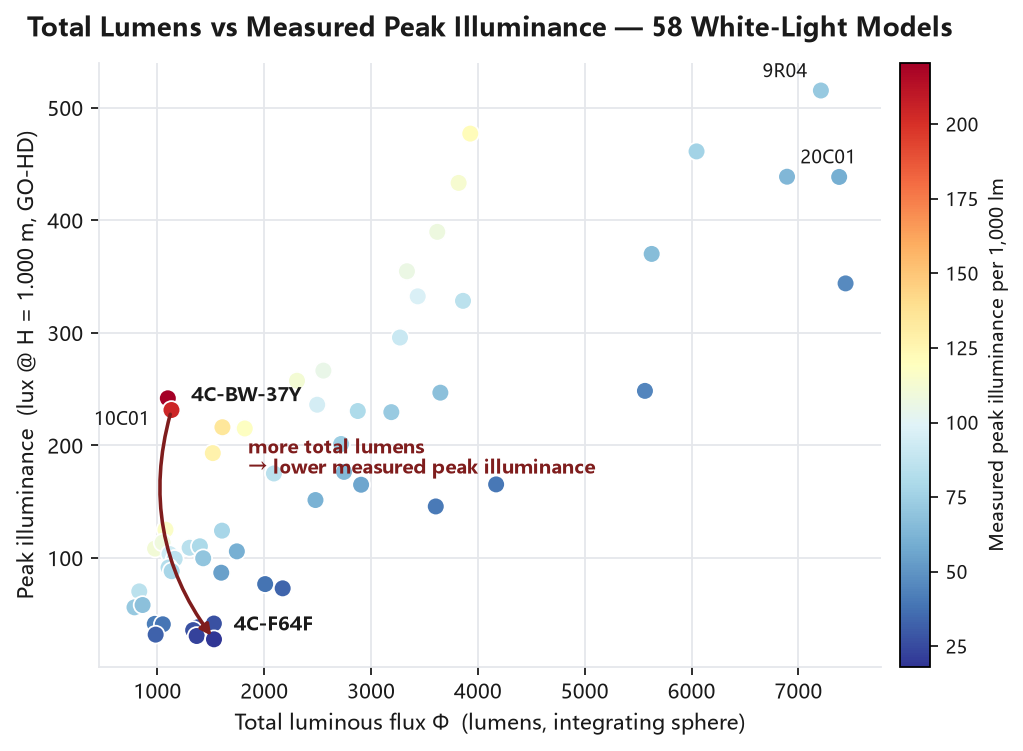
What the chart shows:
- Across the displayed range of these 58 model-level matches, a luminous-flux value alone does not uniquely determine the GO-HD peak illuminance recorded here — the plotted results vary. A scatterplot that is not a straight line does not by itself prove that no predictive relationship exists. No straight-line fit or correlation is claimed here.
- Recorded peak illuminance per 1,000 lm varies by more than 10× across these matches — from about 18 to 220 lx per 1,000 lm. Two models with a similar lumen figure can sit at opposite ends of that scale.
- The single most instructive pair in this archive remains 4C-BW-37Y vs 4C-F64F: about 35 % more total lumens, yet a recorded peak illuminance only about one-eighth as high. Both values are the recorded figures; the pair does not by itself establish which optical difference produced them.
A note on rigour. We matched on a model identifier present in both archives, white-light models only. Every exclusion is recorded with its reason, rather than averaged away:
- five models whose two reports disagree on measured value — 4C-BW-F10, 4C-BW-37F, 4C-BW-F-Y44, 4C-BW-Y12-X, 4C-Y32F. The re-scans used different survey-area settings, so the two readings are not directly comparable — but neither original value is wrong;
- one 24 V model, which is not comparable with our 13.2 V series;
- one color-changing model, for which white-light photometric metrics are not a meaningful comparison basis.
The plotted set is the 58 model-level matches that remained after those exclusions. The exclusion list above is the selection rule in full. Every excluded record keeps its original measured value. And where a report pair can’t be retrieved and re-checked, read the plotted relationship as a description of this particular collection only. Not as a statement about LED lamps in general.
- Total lumens and measured peak illuminance are different quantities. Across this collection, total flux alone does not determine the recorded peak illuminance.
- The 58 pairs are model-level matches, not simultaneous measurements of one specimen. Re-scan disagreement is excluded with its reason recorded, not averaged.
- The inverse-square figure uses illustrative fixed-intensity sources, not DXZ lamp data converted into candela.
- There is no exact lumens → candela conversion for a real lamp without its measured angular intensity distribution.
So Which Number Should You Specify?
| Your application | The number that matters | Why |
|---|---|---|
| Driving light / spot / long-range aux | Candela (and the lux-at-distance it implies) | Reach is a beam-concentration problem |
| Work light / flood / area lighting | Lux over the target area + beam pattern | You care about coverage and evenness, not a single peak |
| Comparing two lamps for “brightness” | Neither alone — lumens with beam pattern | Same lumens, different optics → different job |
| Total luminous output / efficacy | Lumens + lm/W | The correct use of the sphere numbers |
| Electrical load / power budgeting | Input W + current at system voltage | Power budget is an electrical question, not an optical one |
| Compliance / homologation | Regulated value per the applicable standard | The standard names the unit and the geometry |
A lumen figure with no beam data doesn’t tell you how far the lamp reaches. For a long-range application, ask for the directional intensity, the beam pattern, and the task illuminance at the distance you actually use. For a flood or area application, ask about coverage and uniformity across the target. Which number is decisive depends on the installation, not on the unit alone.
FAQ
How many lumens is 1 candela?
There is no fixed conversion. For a hypothetical source radiating uniformly in all directions, 1 cd ≈ 12.57 lm. For real lamps the ratio depends on the beam geometry and on how the light is distributed within the beam. A narrow spotlight can exceed 10,000 cd from a few hundred lumens, while a wide flood of the same output might produce a small fraction of that. You need both the beam angle and a distribution assumption. For a real lamp, measured intensity data is preferable.
Is candela the same as lux?
No, but they are linked by distance and direction: E (lx) = I (cd) × cos θ / d², which reduces to I = E × d² only when the receiving surface is perpendicular to the incident ray. Candela is intensity at the source in one direction. Lux is the illuminance that intensity produces at a given distance and orientation. For a point source at 1 m, on a perpendicular surface, they are numerically equal. At 10 m, 1 cd produces 0.01 lx on that surface.
Why do two lights with the same lumens look different?
Because lumens say nothing about distribution. Two lamps with identical total output can differ greatly in measured peak illuminance — it depends on how their optics concentrate the beam. Among the 58 model-level matches plotted on this page, the recorded peak illuminance per 1,000 lm spans about 18 to 220. That describes this selected collection only. It is not an industry-wide sample, and it does not by itself isolate optical design as the cause.
Which is more important for a driving light — lumens or candela?
For reach and usable beam distance, candela (and the resulting lux at distance) matters far more than total lumens. A high-lumen flood and a lower-lumen focused beam are different products for different jobs; the lumen figure alone will not tell you which one to buy.
Research snapshot and citation
- Research topic
- Lumens, candela and lux in directional LED lighting
- Dataset size
- 58 selected model-level matches between DXZ LED integrating-sphere and GO-HD reports.
- Measurement subject
- Total luminous flux and measured peak illuminance, with the page explaining how the quantities relate to beam distribution and distance.
- Source
- DXZ in-house archive and the source evidence described on this page.
- Scope
- The matched DXZ model set described on this page; the results are not an industry-wide performance sample.
- clarify what lumens, candela and lux measure
- compare the reported model-level output and illuminance observations shown on the page
- convert every real lamp between lumens and candela without beam geometry
- predict real-world performance from lumens alone or represent all products
DXZ Laboratory. Lumens, Candela, and Lux: How to Read DXZ Lighting Reports. DXZ Lighting. This resource explains the three quantities and describes 58 selected model-level matches between the DXZ integrating-sphere and GO-HD archives.
Ordinary linking and citation are welcome. Please contact DXZ before republishing charts, tables or images; this page does not grant image-republication rights.
Research / technical enquiry: For questions about the dataset scope or a request for technical evidence, use the DXZ contact page and reference this resource URL.
Same lab, two instruments, reports on file. If you’re specifying lighting and want the actual numbers behind a product, ask for the photometric data pack on your target product line. Don’t settle for a single headline figure.