
Every LED datasheet in the world prints a color temperature: 3000K, 4000K, 6000K, 6500K. Almost none of them tell you what that number actually constrains.
A “6000K” rating is not a measurement. It is a label. And in the chromaticity standard most often cited for white LED products, 6000K is not one of the eight nominal values.
We own both the products and the instrument, so we can show the measured half. Our in-house archive holds 179 integrating-sphere reports, of which 165 are white-light reports. Each one carries a measured correlated color temperature and a pair of CIE 1931 chromaticity coordinates. A color-temperature label and a measured value answer different questions. This page looks at what the measurements actually recorded. We have not paired every measurement with a product-label claim, so the charts below describe the measured archive, not label accuracy.
- Dataset
- 165 white-light reports (from 179)
- Equipment
- Integrating sphere
- Measurement
- CIE 1931 chromaticity
- Source
- DXZ in-house archive
- Color temperature is printed as a single number but specified as a range. The chromaticity standard most often cited for white solid-state lighting, ANSI C78.377, defines eight nominal CCTs — and 6000K is not one of them.
- Across our 165 white-light sphere reports, measured CCT spans 4,472 K to 9,425 K, with a median of 6,579 K and a standard deviation of 700 K.
- 71.5% of those reports (118 of 165) measure between 6000 K and 7000 K — a band that straddles the seam between two nominal ranges rather than sitting inside one of them.
- Compared with the nominal CCT and Duv windows in the standard’s own table, 122 of 165 measured points (73.9%) fall inside a nominal category. The 43 that do not are mostly cooler than the 6500 K range — outside the eight nominal categories that table defines, which is a limit of the table rather than a defect rate.
- Color temperature says nothing about brightness, output or beam shape. It describes the color of the white, and that is all.
On this page
The LED Color Temperature Scale, Explained
The scale runs the opposite way to ordinary temperature intuition. The naming around it is not standardized either — and that is where most of the confusion starts.
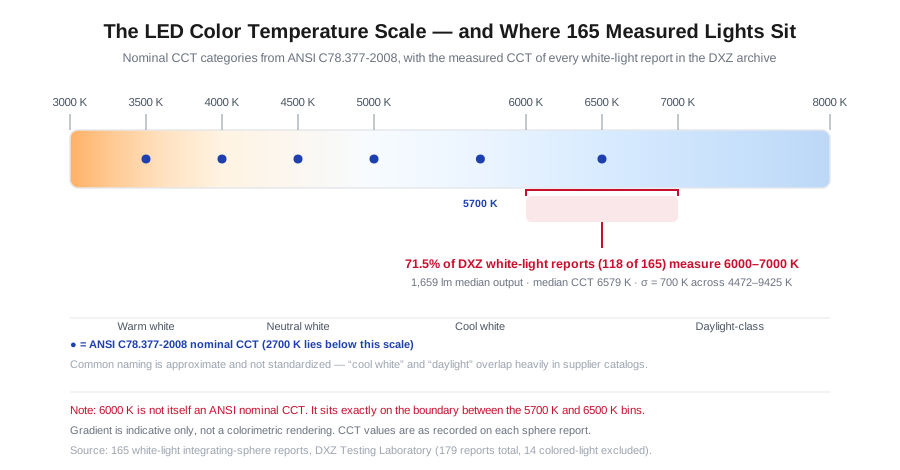
| Measured CCT | What suppliers usually call it | Typical use |
|---|---|---|
| 2700–3000 K | Warm white | Residential, hospitality |
| 3500–4000 K | Neutral white | Indoor work areas, general lighting |
| 4500–5000 K | Cool white | Industrial, task lighting |
| 5700–6500 K | Daylight / cool daylight | Vehicle lighting, work lights, outdoor |
Those four labels are marketing convention, not measurement. Two products marketed as “cool white” can be 1,500 K apart and both be correct.
One practical note before going further: CCT describes the color of white light, not its quality or its quantity. A 6500 K lamp and a 4000 K lamp can have identical output in lumens and still behave completely differently on the road. If you are choosing between them, you are choosing a color, not a brightness.
Why the Chart Has Boxes, Not Points
Here is the part that datasheets omit.
White light is specified by chromaticity coordinates on the CIE 1931 diagram, not by a single kelvin value. A color temperature corresponds to a point on the Planckian locus — the curve traced by ideal blackbody radiation as it heats up. A real lamp’s chromaticity sits somewhere near that curve. Its CCT is then defined by the nearest point on it.
Because real manufacturing has spread, the standard does not define a point. It defines a quadrangle — a small four-cornered region on the chromaticity diagram. A lamp inside that region is allowed to be called by that nominal CCT.
ANSI C78.377-2008 defines eight such quadrangle ranges. The table below reproduces the nominal CCT and Duv windows from that edition — the form this page uses as its reference:
| Nominal CCT | Target CCT and tolerance | Target Duv and tolerance |
|---|---|---|
| 2700 K | 2725 ± 145 K | 0.000 ± 0.006 |
| 3000 K | 3045 ± 175 K | 0.000 ± 0.006 |
| 3500 K | 3465 ± 245 K | 0.000 ± 0.006 |
| 4000 K | 3985 ± 275 K | 0.001 ± 0.006 |
| 4500 K | 4503 ± 243 K | 0.001 ± 0.006 |
| 5000 K | 5028 ± 283 K | 0.002 ± 0.006 |
| 5700 K | 5665 ± 355 K | 0.002 ± 0.006 |
| 6500 K | 6530 ± 510 K | 0.003 ± 0.006 |
Source: ANSI_NEMA_ANSLG C78.377-2008, Table 5, reproduced as a historical reference. ANSI has since published C78.377-2024, whose chromaticity ranges are recommended primarily for general solid-state lighting — not for every automotive auxiliary or coloured signalling lamp. This page does not recalculate classifications against that edition.
Two things stand out.
First, the tolerances are wide, and they widen as the light gets cooler. The 2700 K category allows ±145 K. The 6500 K category allows ±510 K — more than three times as much. So “6500K” is the widest nominal label in that table. A lamp at 6,020 K and a lamp at 7,040 K both fall inside the 6500 K range.
Duv is the second half of the tolerance: the signed distance from the Planckian locus. Positive Duv means the light sits above the locus (toward green); negative means below (toward pink). ANSI allows ±0.006.
- Instrument
- Integrating sphere with spectrometer — spectral scan yielding flux, CCT and CIE 1931 chromaticity coordinates.
- Scope
- 165 white-light reports out of 179. Reports of colour-light sources are excluded, because CCT is not defined for them: four red, five amber/yellow and four blue or mixed-colour records. One amber product filed under a white label is also excluded (dominant wavelength 573 nm, colour purity 94.9%).
- Reference
- ANSI C78.377-2008 Table 5, used as a historical reference: eight nominal CCT categories, each with a CCT tolerance and a Duv tolerance of ±0.006. The current edition is C78.377-2024; this page does not re-derive categories against it.
- Comparison rule
- Each measured CCT and Duv is compared with the nominal CCT and Duv windows in that table. This is a window test, not a full quadrangle determination — the latter would need the standard’s x/y corner coordinates. So it compares our archive with the published ranges, not our catalogue against itself.
- Repeat scans
- 11 model identifiers appear in more than one report — eight in two reports and three in three. Each record is listed separately and never averaged.
What the Measured Reports Show
Theory is easy to state. Here is what our own archive contains.
Across the 165 white-light integrating-sphere reports in the archive — the colour-light records are excluded, because CCT has no meaning for a red, amber or blue source — the measured values are:
| Metric | Value |
|---|---|
| Reports | 165 |
| Minimum CCT | 4,472 K |
| Median CCT | 6,579 K |
| Mean CCT | 6,738 K |
| Maximum CCT | 9,425 K |
| Standard deviation | 700 K |
| Median luminous flux | 1,659 lm |
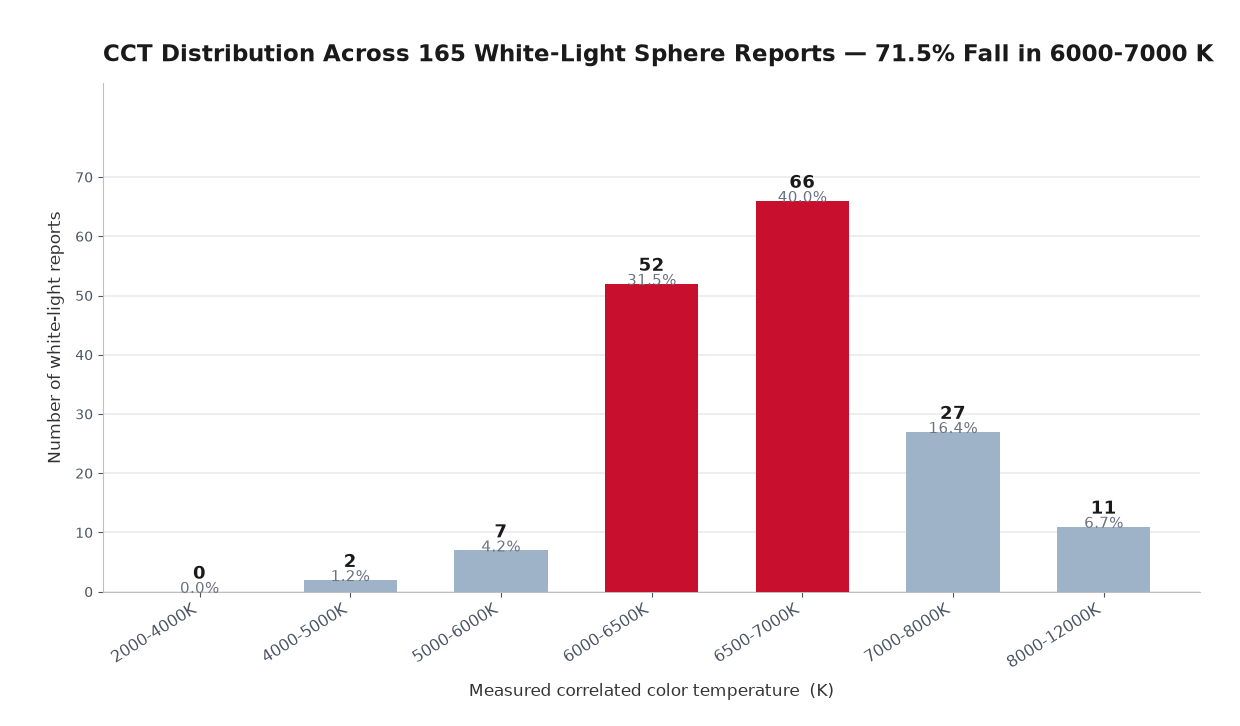
71.5% of the white-light archive — 118 of the 165 reports — measures between 6000 K and 7000 K. That band straddles the seam between the 5700 K and 6500 K nominal ranges. So it describes where our measurements sit, rather than a claim of membership in either category. It is the range most of our vehicle and off-road models are specified in.
Two boundaries in that distribution are worth pointing out, because they are easiest to misread:
- The warm end of the archive is thin: the lowest retained white-light reading is 4,472 K. Below that, the only records we hold are colour-light products, which this analysis excludes because a CCT is not defined for them.
- 38 reports sit above 7,040 K (27 in the 7,000–8,000 K band and 11 above 8,000 K, up to a maximum of 9,425 K). The 2008 table stops at 6500 K nominal, so none of them has a nominal category to fall into.
That is not a defect rate. It is a limit of the table.
Where the Measured Values Sit on the Standard’s Ranges
Now the part that matters. We took all 165 measured chromaticity coordinates and compared them with the eight nominal ranges in the 2008 table.
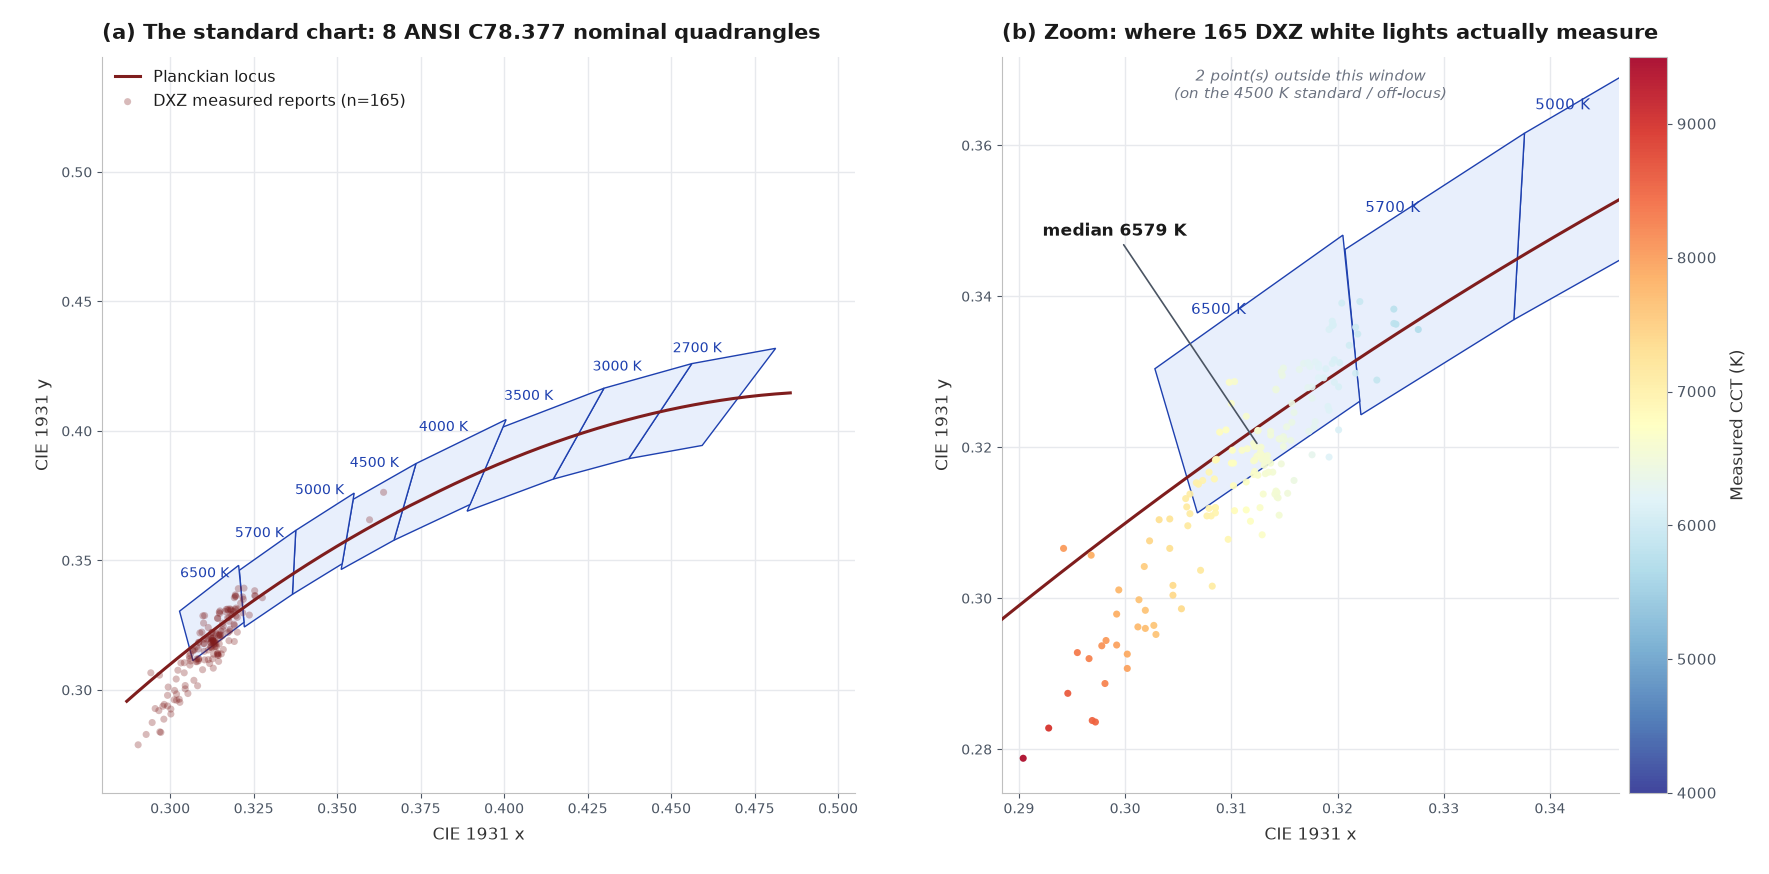
What the plot shows:
- 122 of 165 measured points (73.9%) fall inside a nominal CCT range and its Duv tolerance — 112 in the 6500 K range, 8 in the 5700 K range and 2 in the 4500 K range. The 2,700–4,000 K ranges are empty: the archive’s only readings below 4,000 K belong to colour-light products, which this analysis already excludes.
- The 43 points outside those ranges break down as follows: 38 are cooler than the 6500 K range (above 7,040 K, where the 2008 table defines nothing), and 5 sit inside a nominal CCT range but outside its Duv tolerance of ±0.006. None fall below the 5700 K range.
- The archive sits slightly below the Planckian locus, not above it. Median Duv is −0.0021: 123 points sit below the locus (the pink side) against 41 above (the green side). 135 of 165 (81.8%) are within the ±0.006 Duv tolerance used in the 2008 table. A small offset of this size is common in phosphor-converted white LEDs, and in small doses it is not by itself a defect. The sign simply says which side of the reference curve the measured colour falls on.
One record we are not going to hide. The archive contains a white-light file whose measurement is not white at all. It reports a correlated color temperature of 3,435 K, a dominant wavelength of 573 nm, a colour purity of 94.9% and a Duv of +0.038. That Duv is roughly six times the ±0.006 tolerance in the 2008 table. That is an amber source, not a white one. It stays in the archive and is reported here, but it is excluded from every white-light statistic on this page. Naming it is more honest than quietly deleting it — and far more honest than leaving it inside a white-light average.
And the practical reading for a buyer: when a supplier says “6000K”, ask for the measured CCT and the Duv. A commercial label is a descriptor, not a category. Two lamps sold under the same “6000K” label can sit on opposite sides of the 6,020 K seam and look visibly different side by side. If colour consistency matters across a fleet or a project, the label is not enough information. Ask for the measured value, the range the supplier is working to, and the Duv.
- The archive records measured values only. It holds no per-product datasheet claim, so this page does not compare marketing figures against test figures.
- CCT is undefined for coloured light; the 14 colour-light records in the same archive are excluded from every statistic here.
- The nominal ranges come from the 2008 edition of ANSI C78.377, used as a historical reference. Anything cooler than the 6500 K range (above 7,040 K) has no nominal category to belong to in that table — a limit of the table, not a defect rate.
- The amber record filed under a white label (3,435 K, 573 nm, Duv +0.038) is retained in the archive and reported, but excluded from the white-light statistics.
Repeatability: The Same Model, Measured More Than Once
A single measurement tells you where one unit landed. To say anything about process consistency, you need the same model measured more than once.
Eleven model identifiers in the white-light archive appear in more than one report — eight in two reports and three in three. Their measured CCT values:
| Model | Recorded CCT (each report) | Spread |
|---|---|---|
| RS1C-20 | 6,432 K · 6,435 K | 3 K |
| RS1C-30 | 6,839 K · 6,849 K | 10 K |
| RS1C-10 | 6,378 K · 6,392 K | 14 K |
| RS1C-40 | 6,954 K · 6,988 K | 34 K |
| PY4-7-Spot | 6,581 K · 6,584 K · 6,632 K | 51 K |
| PY4-7-F1ood | 6,570 K · 6,608 K · 6,622 K | 52 K |
| PY35-1-Spot | 6,058 K · 6,110 K · 6,112 K | 54 K |
| M-T5-BS | 7,137 K · 7,361 K | 224 K |
| M-T4-BS | 7,621 K · 7,910 K | 289 K |
| M-T6-BS | 7,386 K · 7,684 K | 298 K |
| M-N-M3-T | 7,645 K · 8,472 K | 827 K |
Read the table from the top. The four RS1C identifiers repeat to within 3–34 K. The three PY identifiers — each recorded three times — stay inside 51–54 K across all three records. At those levels the spread is close to the instrument’s own repeatability, so these model lines read as stable in colour.
The M-series rows are a different story. A spread of 224–298 K across a 7,000–7,900 K nominal is roughly 3–4%. That is real variation between two measurements of the same identifier. It is also the kind of gap the 6500 K range in the 2008 table (±510 K) already permits. The M-N-M3-T pair is wider still at 827 K, which is too large to read as repeatability. That looks like two different configurations recorded under one identifier, and we are not presenting it as a consistency result. Resolving it needs the original product records, not more arithmetic.
We are telling you which rows support the claim and which do not, rather than averaging them into one flattering number.
Which Color Temperature for Which Job
Not a data section — this is engineering guidance, and we are labelling it as such.
| Application | Suggested CCT | Why |
|---|---|---|
| Fog, snow, dust | 3000–4000 K | Lower blue content scatters back less, so less glare into your own eyes |
| General road driving | 5000–6000 K | Balances penetration and visual sharpness |
| Off-road / long-range spot | 6000–6500 K | Sharpest perceived contrast; matches the dominant convention in the segment |
| Work light / flood | 5000–6500 K | Practical compromise for long sessions |
| Matching an existing fleet | Whatever the fleet already is | Mismatched color temperature is more noticeable than any of the above |
The one rule that is not a preference: within a single installation, keep the color temperature consistent. A 5000 K lamp next to a 6500 K lamp looks wrong even when both are performing correctly. If you are specifying a fleet, start from our LED work lights range and ask for the per-model color data.
FAQ
What is a 6000K LED?
6000 K is a very common commercial label in vehicle and work lighting, but it is not one of the eight nominal CCTs in the 2008 edition of ANSI C78.377. In that table the 5700 K range runs from 5,310 K to 6,020 K, and the 6500 K range from 6,020 K to 7,040 K. So a 6,000 K reading falls 20 K inside the 5700 K range — the seam between the two ranges is at 6,020 K. Treat “6000K” as a market label or a rough CCT descriptor, not as a guarantee of membership in any particular category. In our archive, 71.5% of white-light reports measure between 6000 K and 7000 K.
Is 6000K the same as daylight?
Not exactly. Daylight varies with time and weather — roughly 5,500 K at midday sun, cooler under overcast sky. 6400–6500 K is the usual approximation when someone says “daylight”, and neither figure is a standard definition. Treat “daylight” as a marketing word, not a measurable one.
Does a higher color temperature mean a brighter light?
No. CCT describes the color of the white, not how much light there is. Brightness is luminous flux (lumens) and, at a distance, illuminance (lux). Our white-light archive spans 240.7 lm to 9,051 lm, and that spread is driven by design and drive current, not by colour temperature. So CCT is not a usable predictor of lumens in either direction.
What is Duv?
The signed distance from the Planckian locus on the chromaticity diagram. Positive is above the locus (green side), negative is below it (pink side), and the sign is part of the reading: at the same nominal CCT, a positive and a negative Duv of equal size do not look the same. The 2008 table allows ±0.006. 135 of our 165 measured points (81.8%) fall within that tolerance, with a median of −0.0021 — a small offset to the pink side of the locus.
Why do two 6500K lights look different?
Because the 6500 K range is the widest in the 2008 table: ±510 K. Two lamps at 6,020 K and 7,040 K both fall inside it and are visibly different side by side. The wider the tolerance, the less the label tells you — which is why we publish measured CCT and Duv rather than a label. This is a statement about the ranges in that table, not about any particular approval regime for a vehicle lamp.
Is CCT the same as CRI?
No. CCT describes the color of the white; CRI (and Ra) describes how faithfully that light reproduces other colors. They move independently. We cover color rendering in a separate study.
How is color temperature measured?
In an integrating sphere — a hollow sphere with a highly reflective interior that mixes the lamp’s output into a uniform field, where a spectrometer reads the spectrum and derives the chromaticity coordinates and CCT. Every figure on this page comes from that instrument, in our own lab.
Research snapshot and citation
- Research topic
- Measured LED correlated colour temperature and CIE 1931 chromaticity
- Dataset size
- 165 white-light reports selected from 179 integrating-sphere reports.
- Measurement subject
- Correlated colour temperature and CIE 1931 chromaticity coordinates as described in the test archive.
- Source
- DXZ in-house archive and the source evidence described on this page.
- Scope
- Measured values from the selected DXZ white-light archive; the page does not compare each measurement with a corresponding datasheet claim.
- show the CCT distribution and repeat measurements included in the archive
- explain the nominal CCT ranges and chromaticity context cited on the page
- prove that every product carrying a colour label lands at one exact value
- make claims about coloured-light sources or represent the entire LED market
DXZ Laboratory. Measured LED Colour Temperature and Chromaticity in DXZ Test Reports. DXZ Lighting. This resource summarises measured correlated colour temperature and CIE 1931 chromaticity data from 165 white-light integrating-sphere reports selected from a 179-report archive.
Ordinary linking and citation are welcome. Please contact DXZ before republishing charts, tables or images; this page does not grant image-republication rights.
Research / technical enquiry: For questions about the dataset scope or a request for technical evidence, use the DXZ contact page and reference this resource URL.
Every point on it is traceable to a specific sphere report in our archive. If you’re specifying lighting and need the measured colour data behind a product line — CCT, chromaticity coordinates and bin classification — ask us for the photometric data pack.