A GO-HD report shows you one thing: an illuminance pattern under a stated test setup. Before you compare two reports, line up the basics. That means the mounting height, the measurement area, the electrical condition, the lamp configuration and the aiming.
That map describes the tested area, and nothing beyond it. It won’t tell you how far a driver actually sees. It can’t predict a different installation. And it isn’t one brightness number: instead of a single headline lumen figure, the scan maps intensity across a grid of angles.
We run the instrument ourselves, in-house. This page explains what it measures, what our own GO-HD reports actually record, and where the method’s limits are.
- Dataset
- 100 GO-HD reports
- Equipment
- EVERFINE GO-HD
- Measurement
- H = 1.000 m · 5° step
- Source
- DXZ in-house archive
- A goniophotometer measures light distribution by angle, not a single brightness number.
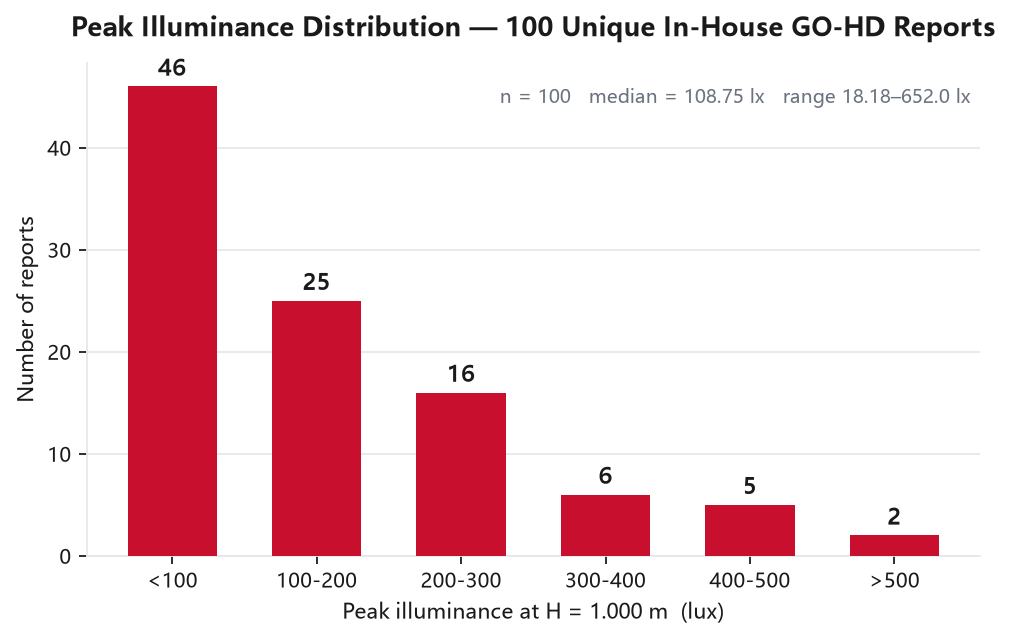
- Our archive holds 100 unique GO-HD illuminance reports covering 95 product model identifiers, all at a fixed mount height of H = 1.000 m.
- Measured peak illuminance spans 18.18 – 652.0 lx, with a median of 108.75 lx.
- Our GO-HD reports are a road-facing partial scan (vertical −10°…+5°, horizontal −30°…+30°) — not a full-sphere IES / LM-79 distribution test. We say so on the page, not in a footnote.
- No marketing curve — just the data and its boundaries.
On this page
What Is a Goniophotometer?
That distinction matters.
A lumen number tells you how much light leaves the fixture. A goniophotometer tells you where it lands — and for a driving light or a work light, “where it lands” is the whole product.
Goniophotometer Types: Why Coordinates Differ
Goniophotometers differ in one main way: how the lamp and the detector are oriented while the scan runs. Three standard geometries cover most of the work:
| Type | Geometry | Typical use |
|---|---|---|
| Type A | Rotation about a horizontal axis, detector fixed | Automotive / signalling lamps — a forward-directed beam measured as it sits on a vehicle |
| Type B | Vertical-axis rotation plus a second horizontal sweep | Architectural and industrial luminaires |
| Type C | Lamp rotates about a vertical axis; mirror or detector tracks the beam | General lighting and IES-format distribution files |
What this means for a buyer: the geometry has to match the product, but the letters alone don’t settle suitability. Labs differ in their coordinate systems and test setups. What matters is the mounting orientation, the angular range covered, the surveyed area and the purpose of the scan. Our own GO-HD reports use a road-facing, forward-looking setup, because that is how our products are used.
Inside Our Lab: Our EVERFINE GO-HD Setup
We produce our road-facing photometric measurements on an EVERFINE GO-HD system. A defined horizontal and vertical measurement window generates the equal-illuminance distributions, and the electrical test data is logged alongside.
Every report records the same conditions. Here they are, exactly as printed on the report:
| Parameter | Value on our reports |
|---|---|
| Instrument | EVERFINE GO-HD system |
| Mount height (H) | 1.000 m |
| Vertical measurement window | −10° … +5° |
| Horizontal measurement window | −30° … +30° |
| Angular step | 5° |
| Ambient conditions | 25 °C / 65 % RH |
| System voltage | ≈ 13.2 V (DC) — on 99 of the 100 reports |
| Power factor logged | 1.000 |
| Operator | DAMIN (signed on report) |
Three things we want to be clear about:
- H = 1.000 m is fixed for every report in the archive. One shared height controls one variable — it doesn’t make two reports comparable on its own. Check the rest first: measurement area, aiming, lamp configuration and drive voltage.
- The measurement window is deliberately narrow. We use it to capture a road-facing beam pattern, not to sweep a full sphere. So it isn’t an IES or LM-79 distribution test, and we don’t present it as one.
- Every report carries its electrical context — voltage, current, power, power factor. Optical output without the drive conditions can’t be reproduced. In practice this matters: 99 of the 100 reports are logged at ≈ 13.2 V, and one report (8C01) is a 24 V system. We flag that one separately instead of mixing it into a 13.2 V ranking.
How a Photometric Test Runs
Each test runs through four stages, all in-house. Nothing is subcontracted.
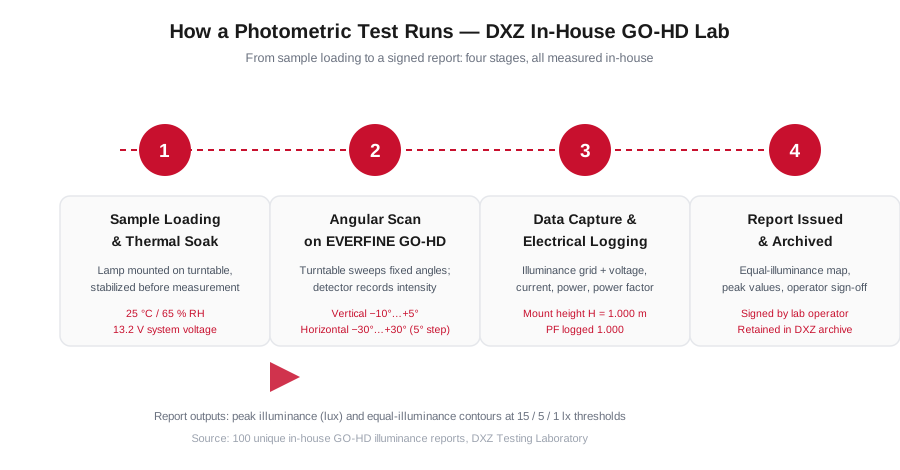
- Sample mounting and test-condition setup. The lamp goes into the test position, and the test conditions are recorded before the scan starts.
- Angular scan. The GO-HD steps the sample through the fixed angular grid, and the detector records intensity at each position.
- Data capture and electrical logging. Illuminance values are captured with the live electrical parameters (≈ 13.2 V, current, power, power factor 1.000). This is what ties an optical figure back to a drive condition.
- Report issued and archived. The output — peak illuminance plus an equal-illuminance map with contour lines — gets signed by the operator and kept in the DXZ archive.
That last point is worth repeating: we keep the reports.
Test reports and certification records answer different questions. A certificate confirms that a declared product conforms to a standard. A test report records what one sample measured under a stated setup. This page is about the second kind only, which is why the conditions are printed alongside every figure.
- Instrument
- EVERFINE GO-HD road-plane photometric system.
- Geometry
- Automotive-style forward-facing scan; vertical −10°…+5°, horizontal −30°…+30°, angular step 5°.
- Condition
- Mount height H = 1.000 m, ambient 25 °C / 65 % RH, system voltage ≈ 13.2 V DC (99 of 100 reports; the remaining report is a 24 V unit). Each report states its own measurement area and aiming.
- Output
- Peak illuminance plus an equal-illuminance contour map, with electrical parameters logged alongside.
- Archive
- Every report is dated, numbered and signed by the DXZ operator who ran it.
What 100 In-House Reports Show
This is the point of a first-party archive: the products, the instrument and the reports all come from us.
Across 100 unique GO-HD illuminance reports — 95 distinct model identifiers — all at a uniform H = 1.000 m:
- Peak illuminance ranges from 18.18 lx to 652.0 lx, with a median of 108.75 lx.
- The distribution leans heavily toward the low end — exactly what you would expect from a portfolio that includes compact marker and interior units alongside high-output bars.
- A few models were re-scanned at a different measurement-area setting, so the archive holds slightly more reports than model identifiers. We count per report — we don’t quietly average the two.
| Peak illuminance band | Reports | Share |
|---|---|---|
| < 100 lx | 46 | 46.0 % |
| 100–200 lx | 25 | 25.0 % |
| 200–300 lx | 16 | 16.0 % |
| 300–400 lx | 6 | 6.0 % |
| 400–500 lx | 5 | 5.0 % |
| > 500 lx | 2 | 2.0 % |
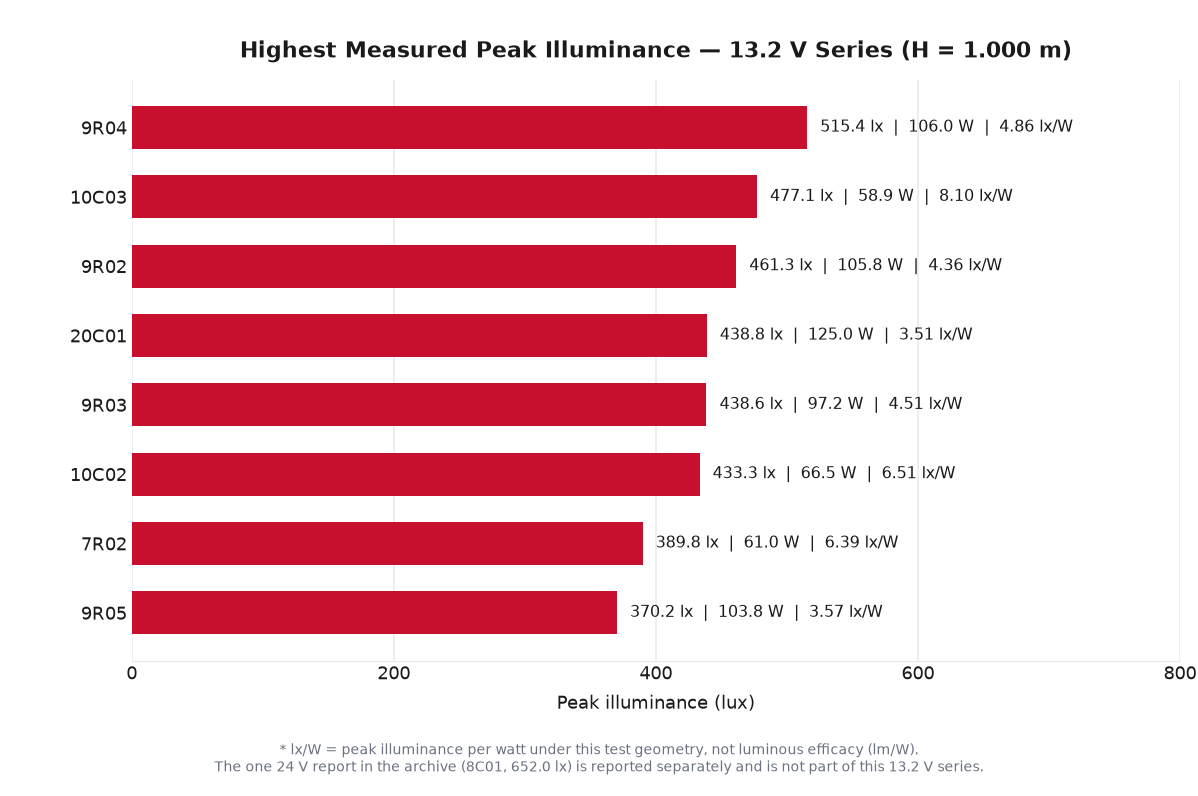
Here is the top of that distribution. Every value comes straight from the source reports.
| Model | Peak illuminance | Power | Peak lx per watt * | Report date |
|---|---|---|---|---|
| 9R04 | 515.4 lx | 106.03 W | 4.86 | 2026-07-09 |
| 10C03 | 477.1 lx | 58.89 W | 8.10 | 2026-07-10 |
| 9R02 | 461.3 lx | 105.81 W | 4.36 | 2026-07-09 |
| 20C01 | 438.8 lx | 124.95 W | 3.51 | 2026-07-10 |
| 9R03 | 438.6 lx | 97.23 W | 4.51 | 2026-07-09 |
| 10C02 | 433.3 lx | 66.53 W | 6.51 | 2026-07-10 |
| 7R02 | 389.8 lx | 61.04 W | 6.39 | 2026-07-09 |
| 9R05 | 370.2 lx | 103.82 W | 3.57 | 2026-07-09 |
Source format for every row: 照度测试/<file>.pdf | GO-HD | <date>.
* Peak illuminance per watt is a derived directional-performance ratio under this test geometry. It is not luminous efficacy (lm/W) — efficacy is a total-output figure and it comes from the integrating sphere, not from this measurement. Nor is it a universal optical-quality score. The ratio depends on the surveyed area, the mount height and the aiming. Compare it only between reports recorded under the same geometry.
One report sits outside the 13.2 V series, and we keep it out of the table above on purpose. 8C01 is the only 24 V unit in the archive. It recorded 652.0 lx at 155.35 W (report 2026-04-24). That is a real figure, taken on the same instrument at the same mount height, but at a different supply condition. So we show it here as a condition-bound reading, not as part of a 13.2 V sort.
Comparing like with like (13.2 V only): under the same test setup, 10C03 produced 477.1 lx at 58.89 W, while 9R04 produced 515.4 lx at 106.03 W. That is about 92.6 % of the peak illuminance from 55.5 % of the power. The point: beam concentration and total luminous output are two different design variables, and the goniophotometer tells them apart.
Download a real photometric report
See the full report, not just the summary. We’ve prepared two of our actual GO-HD illuminance reports — PY35-1-Flood (white) and BF4-9 — as sample downloads, with vendor-sensitive fields redacted. Same instrument, same conditions, same contour format you’d get on a real project.
Or request data for your model
Photometric data is available on request. Our GO-HD example is a partial road-plane illuminance report. If you need an IES-compatible photometric file (LM-63 format) for a specific model and application, ask us. We’ll confirm whether the angular dataset you need exists, and what it covers. Tell us which product you’re specifying and we’ll confirm scope and turnaround.
- This is a road-facing partial scan, not a full-sphere IES / LM-79 distribution test. It shows beam shape and coverage inside the stated window — and nothing outside it.
- Figures are comparable within one voltage group. The single 24 V report (8C01) is flagged, not ranked against the 13.2 V series.
- Peak illuminance per watt is a directional-performance ratio under this geometry, not luminous efficacy (lm/W).
- The 1 lx contour shows the extent of the measured field. It is not a real-world visibility or stopping-distance figure.
How to Read an Equal-Illuminance Map
Peak lux is only half the story. The contour lines on the report show how the measured illuminance is spread across the road plane.
Two samples from our archive, with the measurement area exactly as each report records it:
- PY35-1-Flood (white) — peak 175.3 lx, reported measurement area L = 220.0 m × W = 50.0 m (2026-06-11).
- BF4-9 — peak 230.6 lx, reported measurement area L = 520.0 m × W = 40.0 m (2026-05-27).
The 1 lx contour shows how far the measured illuminance field reaches under the stated test geometry. It should not be read as a direct vehicle visibility distance. Real seeing distance also depends on target reflectance, ambient light, mounting height, aim, road conditions and glare.
That is why we publish the contour, not just the headline peak value. It shows the shape and reach of the measured field — and nothing more.
Goniophotometer vs Integrating Sphere: Which Test Do You Need?
These two instruments answer different questions, and a complete photometric file needs both.
| Goniophotometer (GO-HD) | Integrating Sphere | |
|---|---|---|
| Measures | Light distribution — intensity by angle | Total flux and color — output, efficacy, CCT, CRI |
| Output | Equal-illuminance map, beam pattern | Φ (lm), lm/W, CCT, Ra |
| Answers | “Where does the light go?” | “How much light, and what color?” |
| We have | 100 reports | 179 reports |
We run both. Ask for the goniophotometer data if your question is beam coverage. Ask for the sphere if it is total output or color consistency across a production batch. And if you want the units themselves untangled first — lumens vs candela vs lux — read that article before either report.
FAQ
What is the difference between a goniophotometer and a photometer?
A photometer measures light at a single point or in one direction. A goniophotometer measures intensity across many angles, producing a distribution curve or illuminance map. A photometer gives you one number; a goniophotometer gives you the shape.
How long does a goniophotometer test take?
It depends on the angular grid and the sample under test. In our protocol the settings are recorded before the scan, so a report is not an instant read. It is a controlled measurement at a fixed mount height.
Do I need a goniophotometer report for ECE / E-mark approval?
It depends on the regulation and the product category you are working to. Beam-pattern verification against an applicable ECE regulation is part of the type-approval evidence chain — and distribution measurement is how that pattern is characterised. But an in-house test report and approval documentation answer different questions. Formal E-mark approval rests on certification by an accredited test house, not on our GO-HD report alone. Tell us the category and we will confirm which documentation applies.
Can I get an IES file for DXZ lights?
Ask us about the specific model. IES (LM-63) is an electronic-transfer format for photometric data. Whether we can produce a file depends on the model, and on which angular dataset you need. Tell us the model number and intended application, and we will confirm whether the required C-γ data is available and what scope it covers. Our in-house GO-HD report is a road-plane illuminance measurement. That is a different and narrower dataset than a full distribution file.
Research snapshot and citation
- Research topic
- Automotive LED beam distribution and photometric testing
- Dataset size
- 100 in-house GO-HD illuminance reports covering 95 product model identifiers.
- Measurement subject
- Directional illuminance and beam distribution within the stated road-plane scan window described on this page.
- Source
- DXZ in-house archive and the source evidence described on this page.
- Scope
- DXZ in-house GO-HD reports; the page describes a road-facing partial scan, not a full-sphere IES or LM-79 distribution test.
- show beam distribution and peak-illuminance observations within the stated measurement window
- provide first-party examples of how DXZ records photometric test results
- represent every product or every operating condition
- claim regulatory approval, universal accuracy, or full-sphere performance outside the stated scan
DXZ Laboratory. Goniophotometer Testing: How to Read a DXZ Illuminance Report. DXZ Lighting. This resource summarizes 100 in-house GO-HD illuminance reports covering 95 product model identifiers.
Ordinary linking and citation are welcome. Please contact DXZ before republishing charts, tables or images; this page does not grant image-republication rights.
Research / technical enquiry: For questions about the dataset scope or a request for technical evidence, use the DXZ contact page and reference this resource URL.
The distribution reports and sphere reports behind this article are our own products, run on our own equipment, signed by our own operator. If you are sourcing and want to see the data before you commit, that instinct is right.