
Two reports under the same model name can show a useful difference between recorded measurements. They cannot, by themselves, establish how future production batches will vary. This page walks through selected integrating-sphere report pairs. It explains the conditions recorded for each, and shows which sample and production records a buyer would need for a batch-level assessment.
A datasheet cannot settle that question either. A datasheet is a nominal value and a tolerance band, printed by the party being judged. What this page looks at instead is a second measurement — the same model identifier, measured again on a different day, against the first number.
We own the products and the instrument, so we can show that second measurement. Our archive holds 179 integrating-sphere reports. Of the 147 distinct white-light models inside it, 7 carry a second report. And of those, 3 pairs sit at effectively the same measured colour temperature — the group this page examines most closely.
Across those three selected pairs, measured efficacy moved by 1.2%, 2.3% and 3.1% when the difference is divided by the pair mean. Across the range as a whole, it spans 20.31 to 87.66 lm/W. Those two figures describe different things, and the sections below keep them apart.
This note covers repeat measurements of selected DXZ LED models from the DXZ test archive — 7 white-light models carry a second report, and 3 of those were re-measured at a matched colour temperature.
It reports repeat-test consistency for those selected configurations. It is not a production batch-consistency guarantee, and it is not a per-batch sampling plan.
- Dataset
- 179 sphere reports
- Repeat set
- 7 models · 3 selected pairs
- Instrument
- Integrating sphere
- Period
- 2026-03-10 → 2026-06-29
- Comparing two reports is not the same as assessing production batches. This page compares recorded measurements of the same model identifier. A batch-level assessment would additionally need identified batches, a defined sampling plan and the corresponding production records.
- The archive holds 179 integrating-sphere reports — 165 white light and 14 colored. Every figure below comes from the white-light set, because the colored sources have no meaningful color temperature or rendering value.
- Of 147 distinct white-light models, only 7 carry a second report — and only 3 of those sit at effectively the same measured colour temperature. The sample is small. We say so instead of dressing it up.
- Same model, twice: the three selected pairs differ by 1.2%, 2.3% and 3.1% in luminous efficacy when the difference is divided by the pair mean. The widest gap among these three is 3.1%.
- Across the range, efficacy runs 20.31 to 87.66 lm/W (median 55.57), a coefficient of variation of 29.17%. That describes different product designs in the catalogue, not variation between batches of one product, and it is not directly comparable with the pairwise percentages above.
- Four repeat pairs fall outside the selected group. Their measured colour temperature moved by hundreds of kelvin, so we list them separately rather than let a 29.3% gap sit unlabeled in an average. The cause of the larger differences is unresolved without the underlying sample and configuration records.
On this page
- What a Second Measurement Can — and Cannot — Show
- What the 179 Reports Actually Are
- Across the Range, Efficacy Spans 20–88 lm/W
- Same Model, Twice: What the Repeat Tests Show
- The Four Pairs Outside the Selected Group
- Repeat-Pair Differences vs Product Range: Two Different Quantities
- What This Means If You Are Sourcing From China
- FAQ
What a Second Measurement Can — and Cannot — Show
Most lighting purchases are decided on a sample and then delivered as a batch. Between those two moments sits every risk the buyer actually cares about — and almost none of it is visible on a datasheet.
Two habits of the trade make the problem worse.
The first is that a datasheet quotes a nominal value. A lamp specified as “6000 K, 100 lm/W” is not lying when the delivered unit measures 5900 K and 96 lm/W. It is quoting a target — with a tolerance it usually declines to publish.
The second is that, in practice, most suppliers can measure a sample but cannot re-measure a batch — because they do not own the instrument. A trading company forwards a factory datasheet. A factory with a laboratory can put the same model back in the sphere and print both numbers.
That difference — between reporting and re-testing — is what this page is built on. We are a manufacturer with our own photometric laboratory, and the data below is ours, not a supplier’s.
What the 179 Reports Actually Are
Before any number is quoted, here is exactly what it came from.
| Item | Value |
|---|---|
| Integrating-sphere reports in the archive | 179 |
| ↳ White light | 165 |
| ↳ Colored light (red / amber / blue / mixed) | 14 |
| ↳ Excluded from every figure below | the 14 colored reports |
| Distinct white-light models | 147 |
| Models measured twice | 7 |
| Selected repeats at the same color temperature | 3 |
| Test period | 2026-03-10 → 2026-06-29 |
| Chamber temperature | 25.0 – 25.3 °C |
| Supply voltage | 12.99 – 13.20 V |
Each sphere report is a photometric, colorimetric and electrical measurement in one shot: total luminous flux (Φ), luminous efficacy (lm/W = total flux ÷ input power), correlated color temperature (CCT), and color rendering (Ra). The instrument is an integrating sphere — in our own testing laboratory.
Three boundaries belong here, stated up front because they are easy to blur:
- A repeat report is not the same physical unit. The two reports carry the same model identifier in the system, measured on different dates. This is a repeatability / reproducibility picture of a model line, not a same-unit back-to-back check.
- Colored sources are excluded. CCT and rendering have no physical meaning for a monochromatic emitter, so the 14 colored reports never enter a statistic on this page.
- This is development-stage verification, not production SPC. These reports come from the design and type-approval phase. It is not a per-batch sampling plan, and we are not presenting it as one.
- Instrument
- Integrating sphere — one shot yields total flux Φ (lm), luminous efficacy (lm/W), CCT, Ra and chromaticity.
- Repeat rule
- A second report on the same model identifier, measured on a different date — not the same physical unit back-to-back.
- Selection rule
- A pair is grouped with the three selected pairs when its measured CCT moved by no more than 50 K. This was an analysis choice, not an agreed quality-release tolerance.
- Efficacy set
- All 165 white-light reports carry a recorded flux and power value and are used for the range distribution below. That distribution describes different product designs, and is kept separate from the repeat-pair discussion.
- Environment
- Test period 2026-03-10 → 2026-06-29; chamber 25.0–25.3 °C; supply 12.99–13.20 V.
Across the Range, Efficacy Spans 20–88 lm/W
Start with the wide picture, because it sets the scale that everything else gets compared against.
Across the 165 white-light reports that carry a recorded flux and power value, measured luminous efficacy is:
| Metric | Value |
|---|---|
| Reports with a recorded flux and power value | 165 |
| Minimum | 20.31 lm/W |
| Median | 55.57 lm/W |
| Mean | 54.22 lm/W |
| Maximum | 87.66 lm/W |
| Standard deviation | 15.82 lm/W |
| Coefficient of variation | 29.17% |
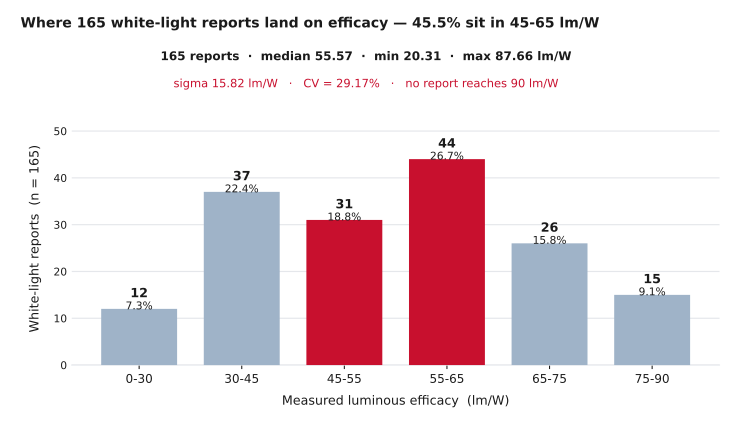
The distribution is broad, and it is shaped the way a full product range should be. The single tallest band is 55–65 lm/W, holding 44 reports (26.7%). The mid band 45–65 lm/W holds 75 reports — 45.5%, very nearly half the archive. It tails off in both directions: 12 reports sit below 30 lm/W, and the entire high end stops at 87.66 lm/W — not one report in the archive reaches 90 lm/W.
Two things follow, and both matter later.
First, this is a range, not a population. The 20–88 lm/W span is the distance between our lowest-output fixture and our highest. A single number like “54 lm/W average” describes the catalogue, not any particular product in it.
Second, efficacy is only comparable at equal color temperature. This is a physics constraint, not a presentation choice. Pushing color temperature toward the cool end lifts luminous efficacy, because the phosphor blend is doing less of the high-energy conversion work. Comparing a 3500 K fixture with a 7000 K fixture on lm/W alone tells you almost nothing. We documented that effect in our LED color temperature chart study. It is also the reason the repeat pairs in the next section are matched on CCT before anything else. Rendering turns out not to be the driver either. In the same archive, measured Ra against efficacy correlates at only r = −0.11, as our color rendering index study found.
Same Model, Twice: What the Repeat Tests Show
Now the narrow picture — the one the buyer actually asked about.
Of the 7 white-light models measured twice, 3 pairs sit at effectively the same measured color temperature. Their recorded efficacy, report against report, is shown below. These are observations from selected report pairs, not a production-batch comparison.
| Model | Report 1 | Report 2 | Mean | Gap | CCT (Δ) |
|---|---|---|---|---|---|
| PY35-1-Spot | 82.01 lm/W | 82.98 lm/W | 82.50 | 1.2% | 6110 → 6112 K (2 K) |
| PY4-7-Spot | 75.31 lm/W | 77.07 lm/W | 76.19 | 2.3% | 6581 → 6584 K (3 K) |
| PY4-7-F1ood | 73.80 lm/W | 76.12 lm/W | 74.96 | 3.1% | 6608 → 6622 K (14 K) |
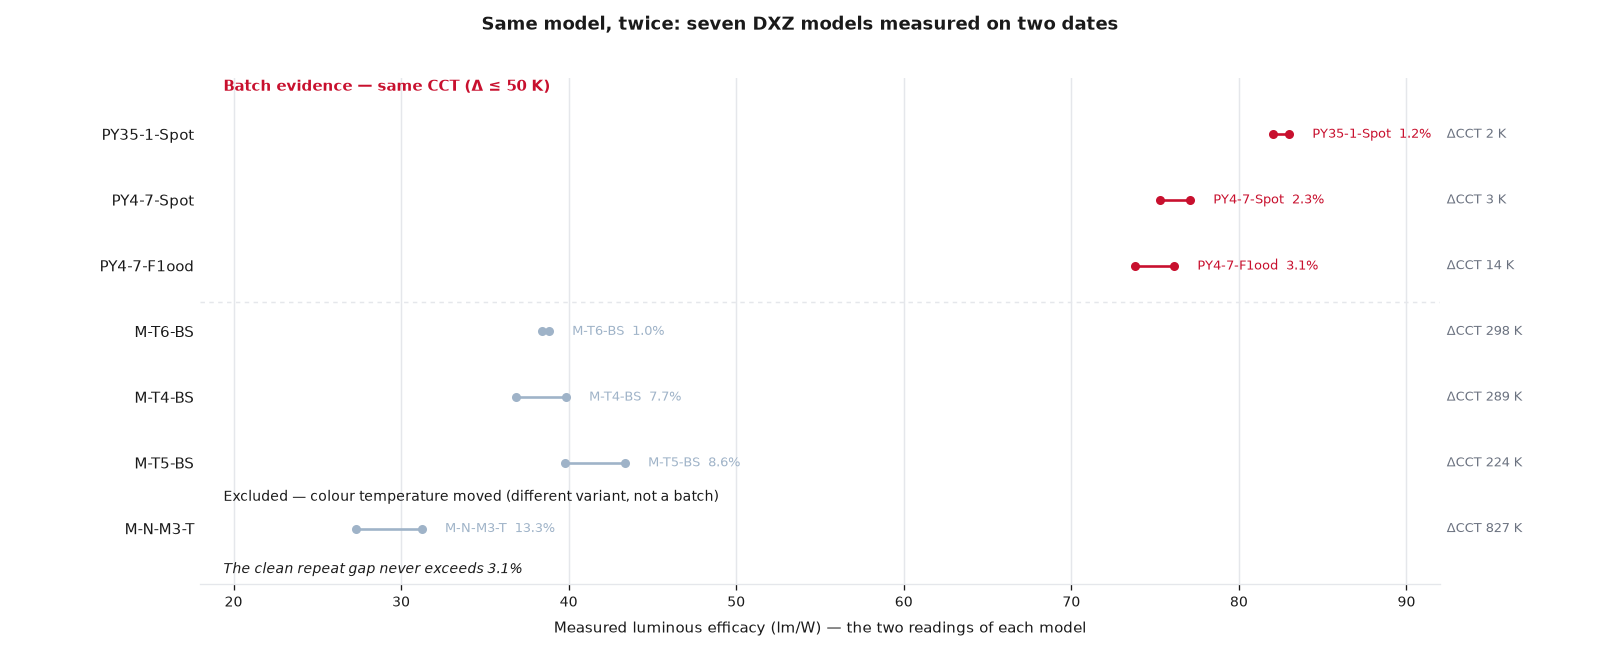
Read the right-hand column first. The gap between two independent measurements of the same model is 1.2% to 3.1% — and the widest of the three is still under 3.1%.
The color temperature column earns its place too. These three pairs drifted by 2 K, 3 K and 14 K — effectively indistinguishable. That is why they are grouped together, rather than compared with pairs whose colour temperature moved by hundreds of kelvin.
There is one more honest caveat, and it is worth stating rather than burying. Look at where the three selected pairs sit: 73.8 to 83.0 lm/W — the high-output end of our range. We do not have a same-CCT selected pair from the low-efficacy end of the catalogue. So this is a statement about the models we have retested at matched color temperature — not a claim about every product we ship. If you want a specific model’s repeat data and we have it, you get it. If we do not have it, we will say so.
The Pairs We Threw Out — and Why
The archive has 7 models with two reports, but only 3 of them became the table above. Here is what happened to the other four — and why excluding them is the honest move.
| Model | Report 1 | Report 2 | Gap | CCT span | Verdict |
|---|---|---|---|---|---|
| M-T6-BS | 38.41 lm/W | 38.81 lm/W | 1.0% | 7386 → 7684 K (298 K) | Observation |
| M-T4-BS | 36.88 lm/W | 39.82 lm/W | 7.7% | 7621 → 7910 K (289 K) | Excluded |
| M-T5-BS | 39.76 lm/W | 43.34 lm/W | 8.6% | 7137 → 7361 K (224 K) | Excluded |
| M-N-M3-T | 27.33 lm/W | 31.22 lm/W | 13.3% | 7645 → 8472 K (827 K) | Excluded |
The rule applied before this table was built: a pair is grouped with the three selected pairs only if the measured colour temperature held still. A 50 K tolerance was used. A pair whose CCT moved by hundreds of kelvin is not two reports of the same colour. Whether it reflects a different configuration, a different record, or another factor is unresolved without the underlying sample and BOM records. So we present it separately, rather than reading its spread as “batch variation”.
One more pair belongs in this discussion even though it is not a white-light repeat. PY35-1-F1ood carries two reports as well — 61.09 lm/W at 3435 K and 82.03 lm/W at 6110 K. That is a 29.3% gap, alarming if it were batch drift. It is not counted in the table above because the 3435 K record is classified as an amber product: its measured Ra is 42.0, against 72.7 for the white record of the same model root. The efficacy change simply tracks the colour-temperature change described in the previous section. We publish the pair rather than delete it.
M-T6-BS is the interesting case, and it is why the verdict column has three values instead of two. Its efficacy held together beautifully — a 1.0% gap — but its CCT swung 298 K. So we file it as an observation, not evidence: efficacy can be stable while color temperature moves. That is a genuinely useful thing to know about a model line, and it is a different claim from “the batch is consistent”. Rather than fold a mixed result into a tidy statistic, we name it.
Which is the whole argument of this section. A supplier who is not checking color temperature will read that 29.3% as a batch disaster, or delete it. We publish it, with the reason.
Repeat-Pair Differences vs Product Range: Two Different Quantities
Put the two pictures side by side and the practical advice falls out.
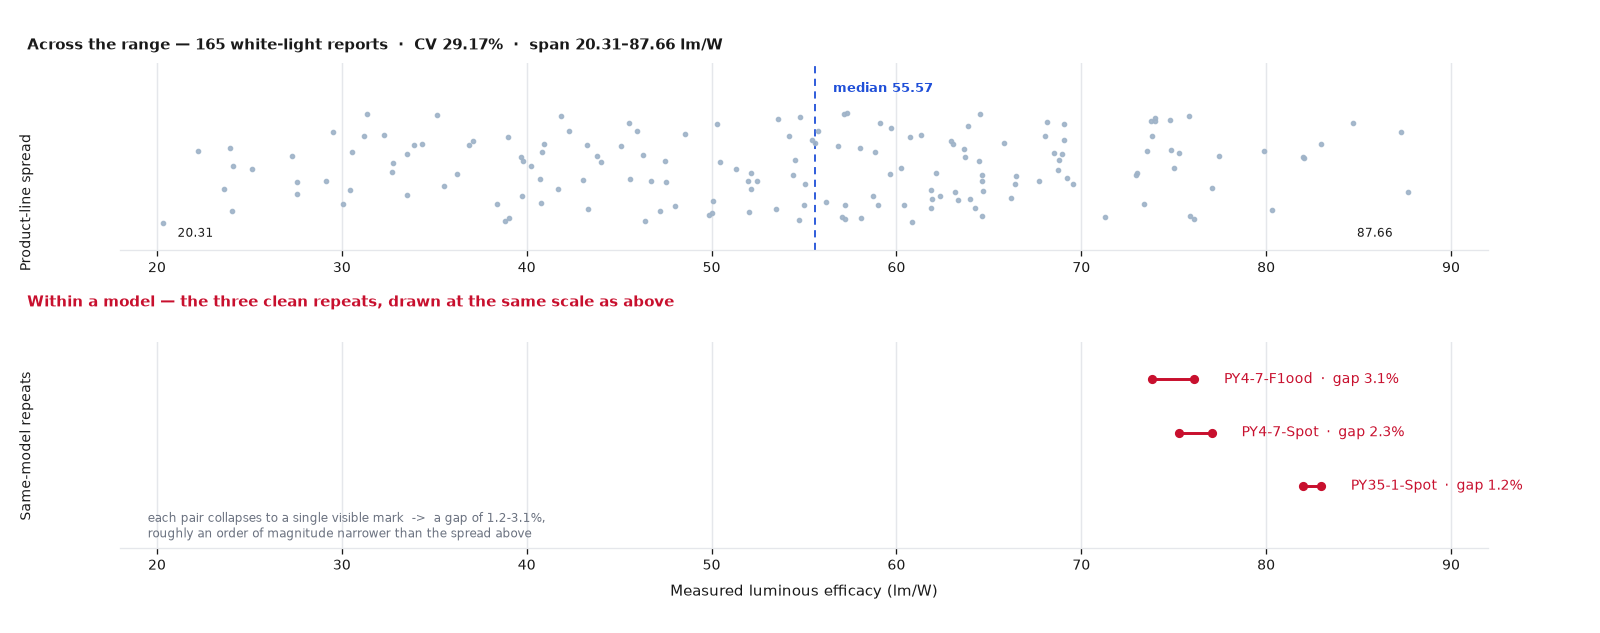
- Within a model — same identifier, same color temperature, two separate measurements: the gap is 1.2% to 3.1%.
- Across the range — 165 white-light reports, all models and all color temperatures: the spread is a coefficient of variation of 29.17%, over an absolute span of 20.31 to 87.66 lm/W.
These two figures are not directly comparable, and we do not set them against each other as a ratio. The 29.17% coefficient of variation is a spread across 165 different product designs — many models, many colour temperatures. The 1.2–3.1% figures are pairwise differences between two reports of the same model identifier. Different populations, different denominators, different statistics.
The procurement consequence is direct, and it is the reason this page exists:
What the two figures do support is a practical point about where to look first. The differences between different models are much larger than the difference between two reports of the same model. If a project’s numbers look marginal, re-check the model choice and its headroom before assuming the supply itself is the problem.
What the data cannot do is predict the next delivery. Three selected pairs cannot establish next-batch variation, an upper bound for it, or an acceptance rate. For that, a project needs identified batches and a sampling plan, not this page.
One caveat we will not skip. The 1.2–3.1% band contains both real batch variation and the repeatability of the measurement chain itself — the sphere, the power supply, the ambient conditions. Separating those two contributions would take a designed experiment we have not run, so we are not going to attribute the whole 3% to production drift. What the data supports is the comparison that matters here: the within-model gap is small next to the across-model spread.
- This is a comparison of recorded measurements for selected models, not a production batch-consistency guarantee.
- The selected same-CCT group is 3 pairs — a small sample, stated as such rather than dressed up.
- The 1.2–3.1% band contains both real batch variation and measurement repeatability; separating them would need a designed experiment we have not run.
- All three selected pairs sit at the high-output end (73.8–83.0 lm/W). There is no same-CCT selected pair from the low-efficacy end.
- Figures come from the development / type-approval phase, not per-batch production SPC.
What This Means If You Are Sourcing From China
The commercial question behind all of this is usually not a photometric one. It is: how do I tell a real factory from a trading company, when both send me a nice datasheet?
| What you want to know | What this page answers | What it does not |
|---|---|---|
| Will the batch match the sample? | Same-CCT repeat gaps of 1.2–3.1% on the models we have re-measured | Per-batch production data — we do not publish a per-batch full-inspection claim |
| How do I compare two models? | Full-range efficacy distribution: 20–88 lm/W, median 55.57 | Prices and lead times for a specific model |
| Is color temperature stable? | Matched repeats hold CCT to 2–14 K | Long-term lumen depreciation (needs ageing data, a separate study) |
| Is it a factory or a trader? | Our own integrating sphere and goniophotometer, reports traceable to source files | Capacity and certification detail — see the OEM/ODM pages |
Two things make the second column possible. The first is that the instrument is ours — we run the measurements in our own laboratory, rather than forwarding a partner’s datasheet. That is why a “second report on the same model” even exists to be published. The same archive feeds our beam-distribution work, from what a goniophotometer measures to the difference between lumens, candela and lux.
The second is that we are willing to publish the results that are inconvenient. That includes the 29.3% pair that is not batch drift, the 1.0% pair whose color temperature moved anyway, and the fact that only 3 of 147 models have a matched repeat at all. A supplier who only shows you the favorable measurement is telling you where the edge of their evidence is.
If your evaluation needs the measured data behind a product line — flux, efficacy, CCT, rendering, and any repeat reports we hold for the model — ask, and we will send what we have. If you are choosing a range to build a programme around, start from our LED work lights. If you need a sampling plan for volume production, tell us the quantity and frequency and we will quote it. What we will not do is take development-stage repeat measurements and dress them up as an every-batch guarantee.
FAQ
What is batch consistency in LED manufacturing?
How repeatable a model’s key figures are between production batches of the same model. It falls under supplier quality commitment rather than any single universal figure, which is why it is best judged from a supplier’s own re-measurements and production records rather than from a datasheet alone.
How do you test batch consistency?
Take the same model identifier, measure it in an integrating sphere on different dates, and compare the results. That is exactly the method behind this page: 179 sphere reports, of which 8 models carry a second report.
How much variation is normal between LED batches?
There is no single accepted figure. In our archive, the three selected same-color-temperature repeat pairs differ by 1.2%, 2.3% and 3.1% in luminous efficacy. The much larger spread you see across our range — 20.31 to 87.66 lm/W — is the difference between products, not between batches of one product.
Is a 3% difference in efficacy significant?
It depends what you are comparing it with. Next to the spread across our range — a coefficient of variation of 29.17% across different product designs — a 3% pairwise difference is small. But the two are different quantities, so the comparison is only a guide: it does not set an acceptance threshold, and it does not predict the next delivery.
Why do some repeat reports differ by 29%?
The largest gap in our archive, 29.3% on PY35-1-F1ood, comes from two reports at 3435 K and 6110 K. The 3435 K record is classified as an amber product (measured Ra 42.0), so this pair sits outside the white-light repeat set and outside the four pairs in the table above. The efficacy change tracks the colour-temperature change, which is the expected physical behaviour. Whether the two reports are a warm-white and a cool-white variant, two different configurations, or two different records is not established from these reports alone. It stays an open question until the sample and configuration records are checked. The pair is listed separately, rather than counted as batch variation.
How many of your models have been retested?
Of 147 distinct white-light models, 7 have a second report, and 3 of those are matched repeats at the same color temperature. We state the small sample rather than imply a broader one.
Can I get the raw test reports?
Yes, per model. We can provide the measured data pack — flux, efficacy, CCT, rendering and chromaticity — for the models you are evaluating. Reports are traceable to the original files.
Do you test every production batch?
This page reflects development and type-approval repeats, not a production sampling plan. Per-batch inspection is agreed per project; ask with your quantity and frequency and we will quote it.
What affects LED efficacy most?
Emitter bin, phosphor blend, drive current and junction temperature — and the target color temperature, which is why efficacy is only comparable at matching CCT.
Are you a factory or a trading company?
A manufacturer with its own photometric laboratory: an integrating sphere for flux and efficacy, and a goniophotometer for beam distribution. The “second report on the same model” exists because the instrument is in-house.
How does DXZ keep batches consistent?
Consistency is managed through emitter-bin control, drive-consistency design and post-freeze sampling agreed per project. On this page, the verifiable statement is narrower: for every model where we hold a same-CCT repeat, the two recorded measurements agree to within 3.1%. A batch-level consistency claim would need the QC, BOM and batch-sampling records behind it. Those are agreed per project, not assumed here.
Research snapshot and citation
- Research topic
- Selected repeated records in DXZ LED models
- Dataset size
- 179 integrating-sphere reports, of which 165 are white-light; 7 white-light models have a second report, including 3 selected pairs at effectively the same recorded colour temperature.
- Measurement subject
- Repeat luminous-efficacy and colour-temperature results described in the selected reports.
- Source
- DXZ in-house archive and the source evidence described on this page.
- Scope
- Selected DXZ archive reports and repeat measurements; this is not a production-wide or industry-wide batch sample.
- show recorded differences between the two reports of selected model pairs
- show how the published archive keeps repeat-pair figures separate from the broader product range
- prove that every future batch will match an approved sample
- establish an industry average or guarantee future production performance
DXZ Laboratory. Repeat Measurements in Selected DXZ LED Models: What the Reports Show. DXZ Lighting. This resource summarizes selected DXZ archive reports, including 179 integrating-sphere reports and the repeat measurements identified on the page.
Ordinary linking and citation are welcome. Please contact DXZ before republishing charts, tables or images; this page does not grant image-republication rights.
Research / technical enquiry: For questions about the dataset scope or a request for technical evidence, use the DXZ contact page and reference this resource URL.
Including the pairs we list separately, and the sample size we would rather have been larger. If you’re evaluating lighting, ask us for the available test records for your model — efficacy, CCT, rendering, and any repeat reports we hold — and tell us about a project-specific batch sampling plan.